آستانه گذاری تقسیم بندی Otsu
در آستانه گذاری تقسیم بندی Otsu قرار است از خروجی دوم روش آستانه گیری ساده، retVal استفاده کنیم. چرا ما از این روش استفاده میکنیم؟?
مفهوم آستانه گذاری تقسیم بندی Otsu
در آستانه گیری ساده ما از یک مقدار سراسری استفاده کردیم. ولی از کجا بدونیم این مقدار، یک مقدار خوب و بهینه است؟ بله. با آزمون و خطا.
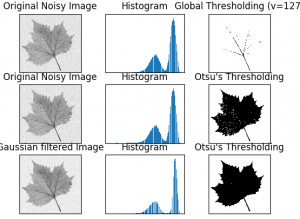
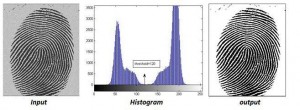
روش آستانه گذاری Otsu ، تصویر را به گونه ای تقسیم بندی میکند که تصویر با بهترین مقدار آستانه به دو کلاس سیاه و سفید یا پیش زمینه و پس زمینه یا پس زمینه و شی تقسیم میشود:
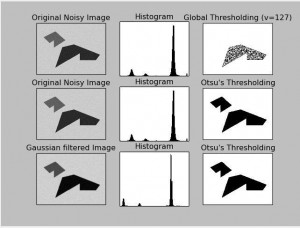
در یک تصویر bimodal (تصویری که هیستوگرام آن دارای دو قله میباشد)، تقریبا در وسط قله ها میتوان آستانه بهینه را انتخاب کرد.
برای همین ما از تابع cv2.threshold() استفاده میکنیم ولی یک فلگ اضافی ، cv2.THRESH_OTSU را داریم . این روش مقدار بهینه آستانه را در retVal قرار میدهد و مقدار threshold برابر ۰ میشود.
import cv2
import numpy as np
from matplotlib import pyplot as plt

img = cv2.imread('bimodal_hsv_noise.png',0)

# global thresholding
ret1,th1 = cv2.threshold(img,127,255,cv2.THRESH_BINARY)

# Otsu's thresholding
ret2,th2 = cv2.threshold(img,0,255,cv2.THRESH_BINARY+cv2.THRESH_OTSU)

# Otsu's thresholding after Gaussian filtering
blur = cv2.GaussianBlur(img,(5,5),0)
ret3,th3 = cv2.threshold(blur,0,255,cv2.THRESH_BINARY+cv2.THRESH_OTSU)

# plot all the images and their histograms
images = [img, 0, th1,
          img, 0, th2,
          blur, 0, th3]
titles = ['Original Noisy Image','Histogram','Global Thresholding (v=127)',
          'Original Noisy Image','Histogram',"Otsu's Thresholding",
          'Gaussian filtered Image','Histogram',"Otsu's Thresholding"]

for i in xrange(3):
    plt.subplot(3,3,i*3+1),plt.imshow(images[i*3],'gray')
    plt.title(titles[i*3]), plt.xticks([]), plt.yticks([])
    plt.subplot(3,3,i*3+2),plt.hist(images[i*3].ravel(),256)
    plt.title(titles[i*3+1]), plt.xticks([]), plt.yticks([])
    plt.subplot(3,3,i*3+3),plt.imshow(images[i*3+2],'gray')
    plt.title(titles[i*3+2]), plt.xticks([]), plt.yticks([])
plt.show()
تک آستانه، دو سطحی
اینجا پیکسلهای سفید پس زمینه و سیاه، شی یا پیش زمینه را نشان میدهند. در یک تصویر bimodal (تصویری که هیستوگرام آن دارای دو قله میباشد)، تقریبا در وسط قله ها میتوان آستانه بهینه را انتخاب کرد.
آستانه گذاری دوسطحی یک مقدار آستانه دارد و پیکسلهای تصویر به دو گروه یا کلاس تقسیم میشوند. انتخاب آستانه در این گروه تصاویر بسیار ساده از آستانه گذاری چند سطحی میباشد.
آستانه گذاری چند سطحی با چند آستانه
تصویری که بیش از یک آستانه دارد، آستانه گذاری چند سطحی میباشد.
import cv2
import numpy as np
from matplotlib import pyplot as plt
img = cv2.imread('sample.jpg',0)
ret1,th1 = cv2.threshold(img,127,255,cv2.THRESH_BINARY)
ret2,th2 = cv2.threshold(img,0,255,cv2.THRESH_BINARY+cv2.THRESH_OTSU)
blur = cv2.GaussianBlur(img,(5,5),0)
ret3,th3 = cv2.threshold(blur,0,255,cv2.THRESH_BINARY+cv2.THRESH_OTSU)
images = [img, 0, th1,
img, 0, th2,
blur, 0, th3]
titles = ['Original Noisy Image','Histogram','Global Thresholding (v=127)',
'Original Noisy Image','Histogram',"Otsu's Thresholding",
'Gaussian filtered Image','Histogram',"Otsu's Thresholding"]
for i in xrange(3):
plt.subplot(3,3,i*3+1),plt.imshow(images[i*3],'gray')
plt.title(titles[i*3]), plt.xticks([]), plt.yticks([])
plt.subplot(3,3,i*3+2),plt.hist(images[i*3].ravel(),256)
plt.title(titles[i*3+1]), plt.xticks([]), plt.yticks([])
plt.subplot(3,3,i*3+3),plt.imshow(images[i*3+2],'gray')
plt.title(titles[i*3+2]), plt.xticks([]), plt.yticks([])
plt.show()
🆔@image_Process
https://t.me/image_Process


